Shop
Texas Demographic Analysis Map License
From: $20.00 / month
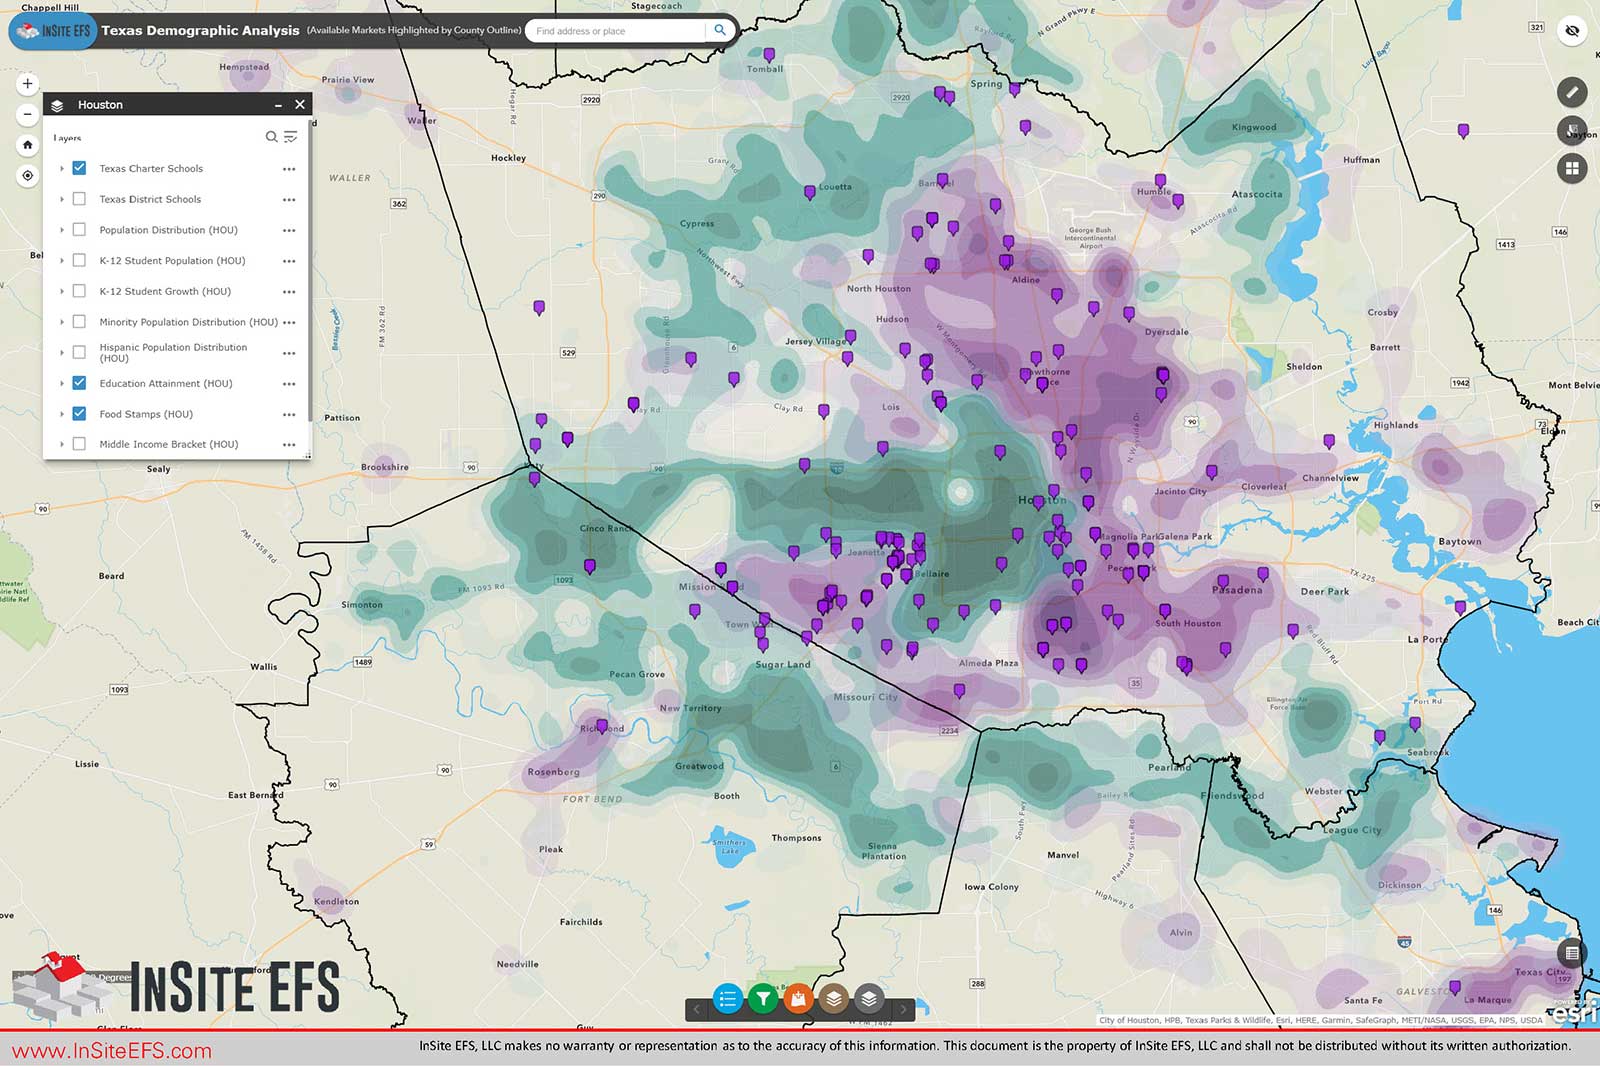
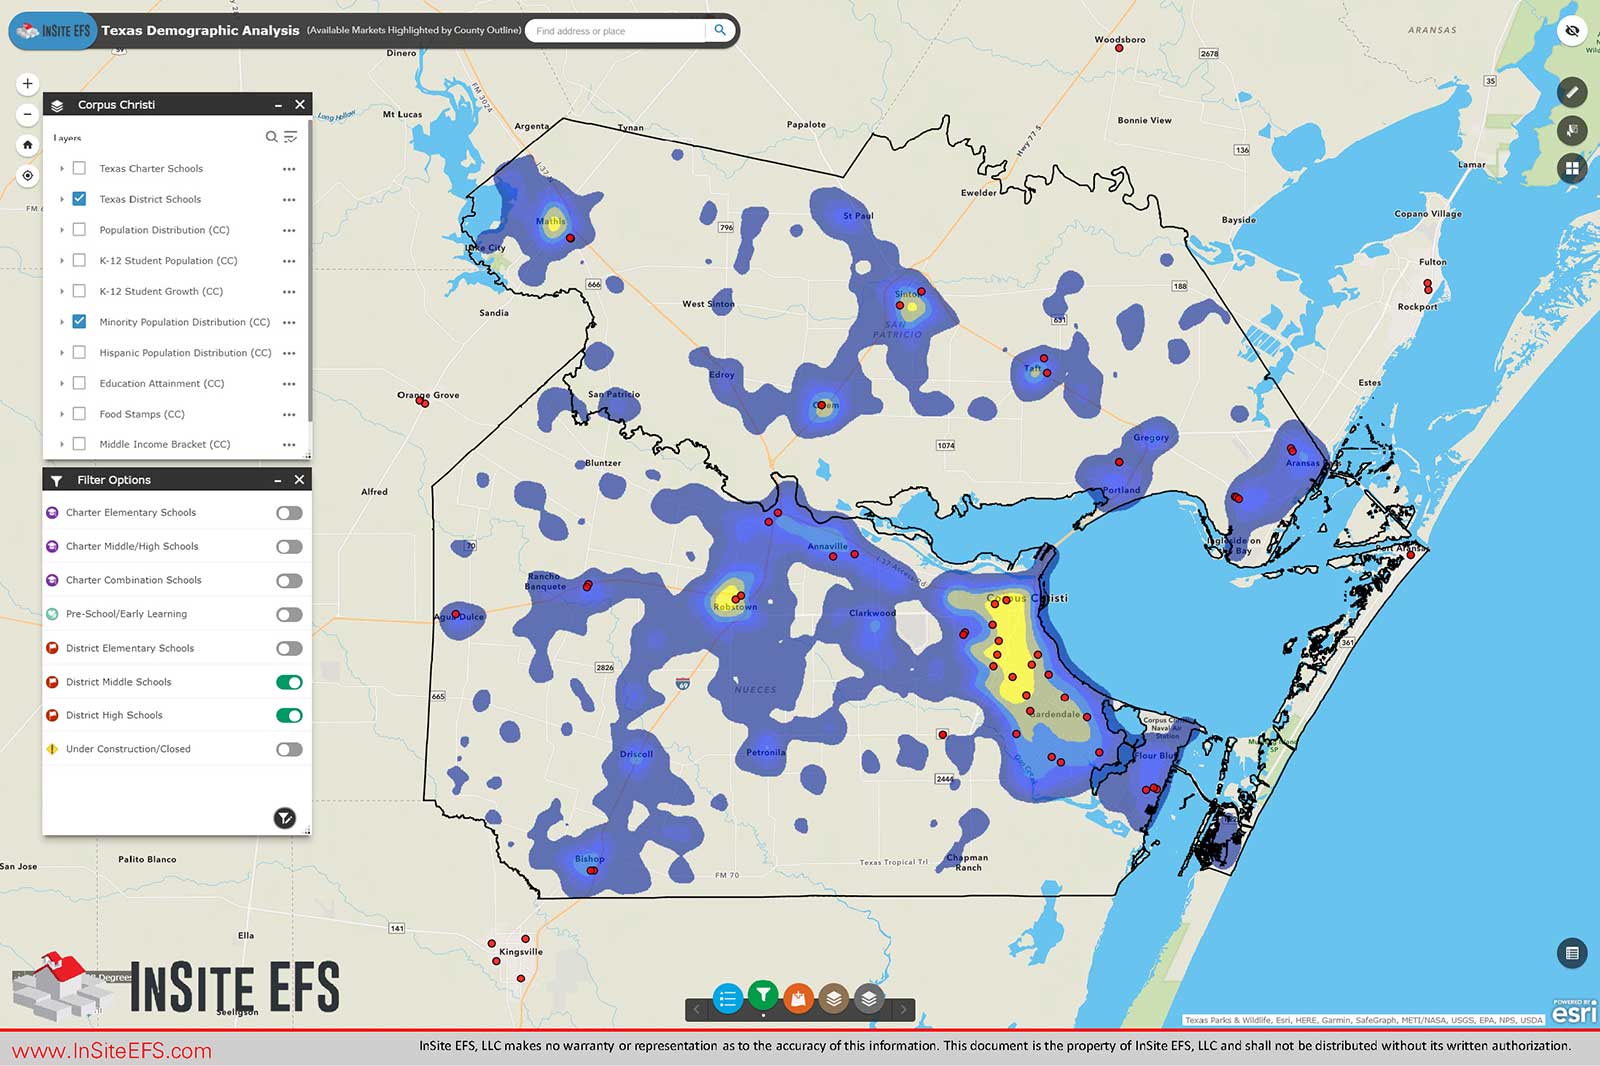
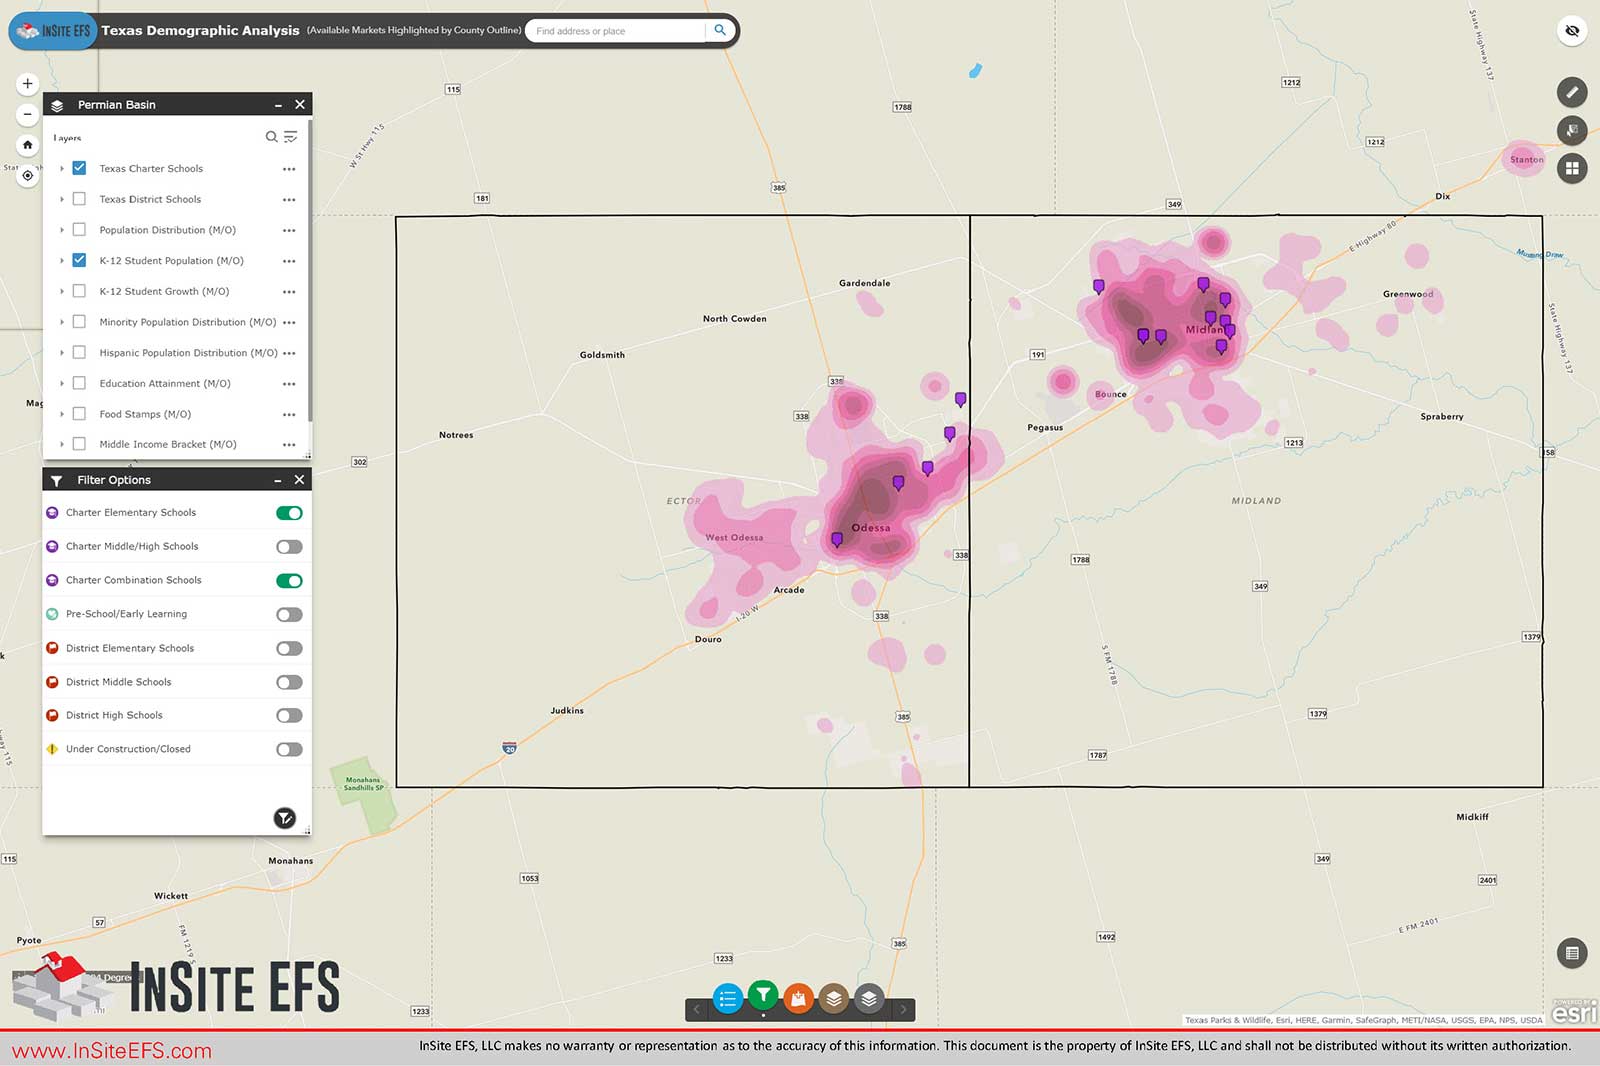
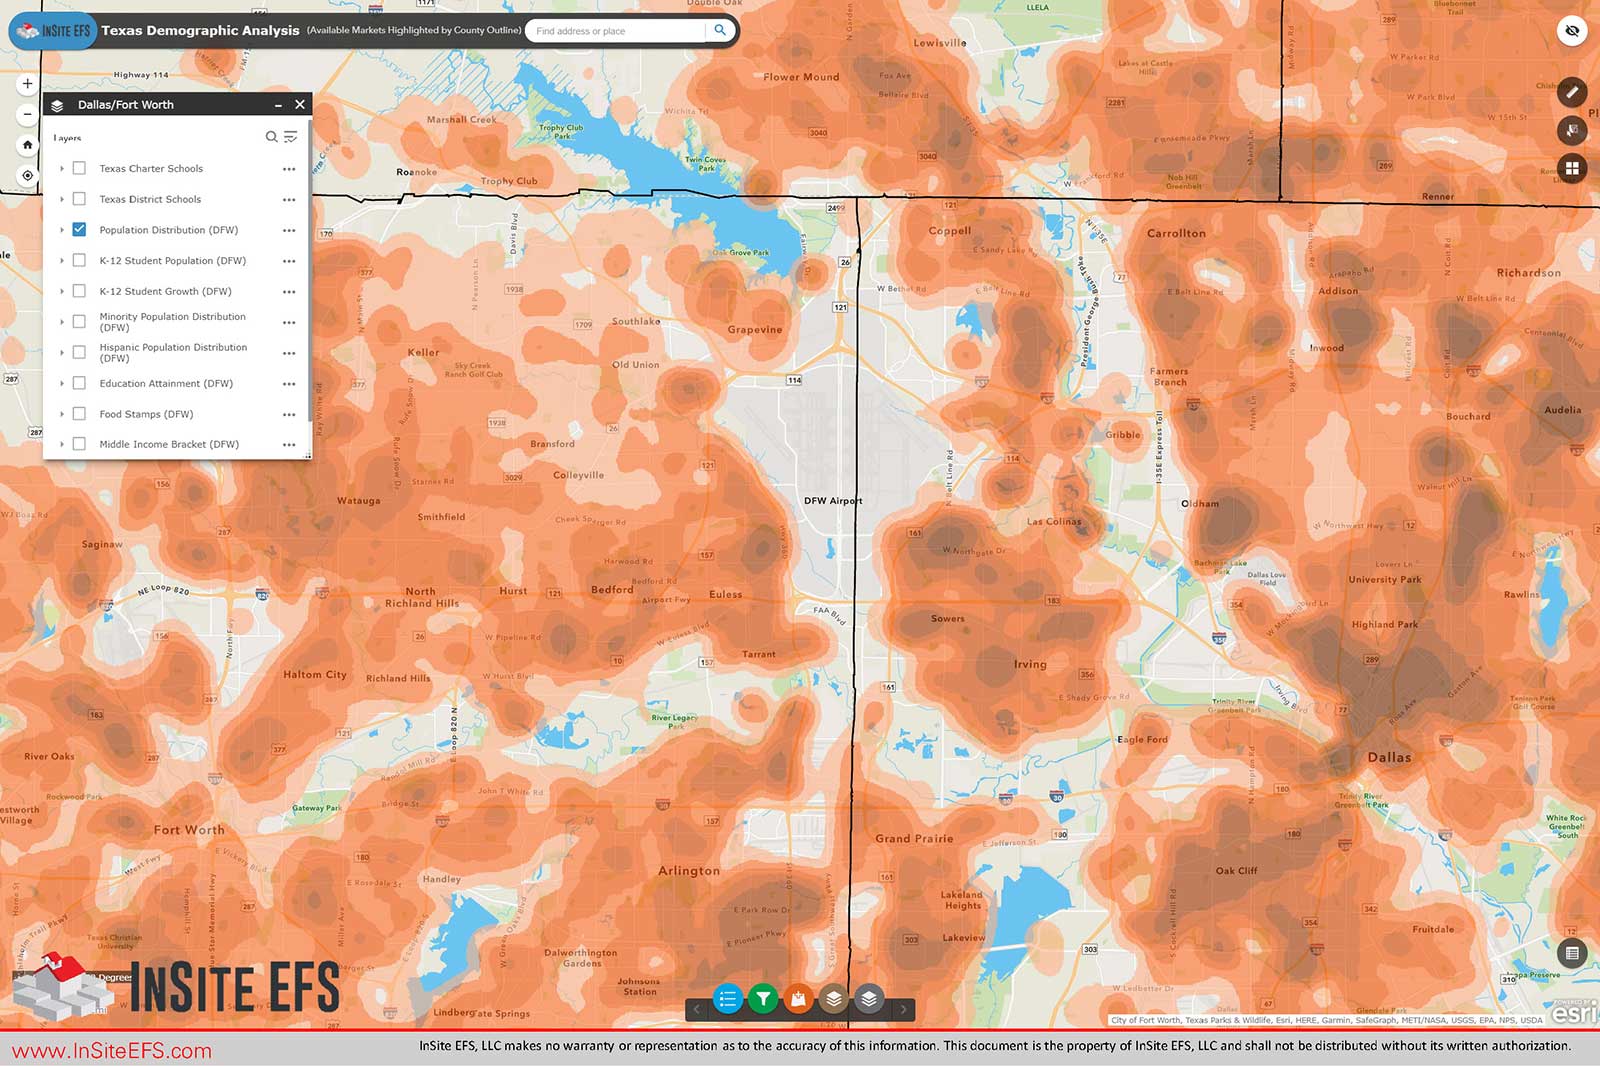
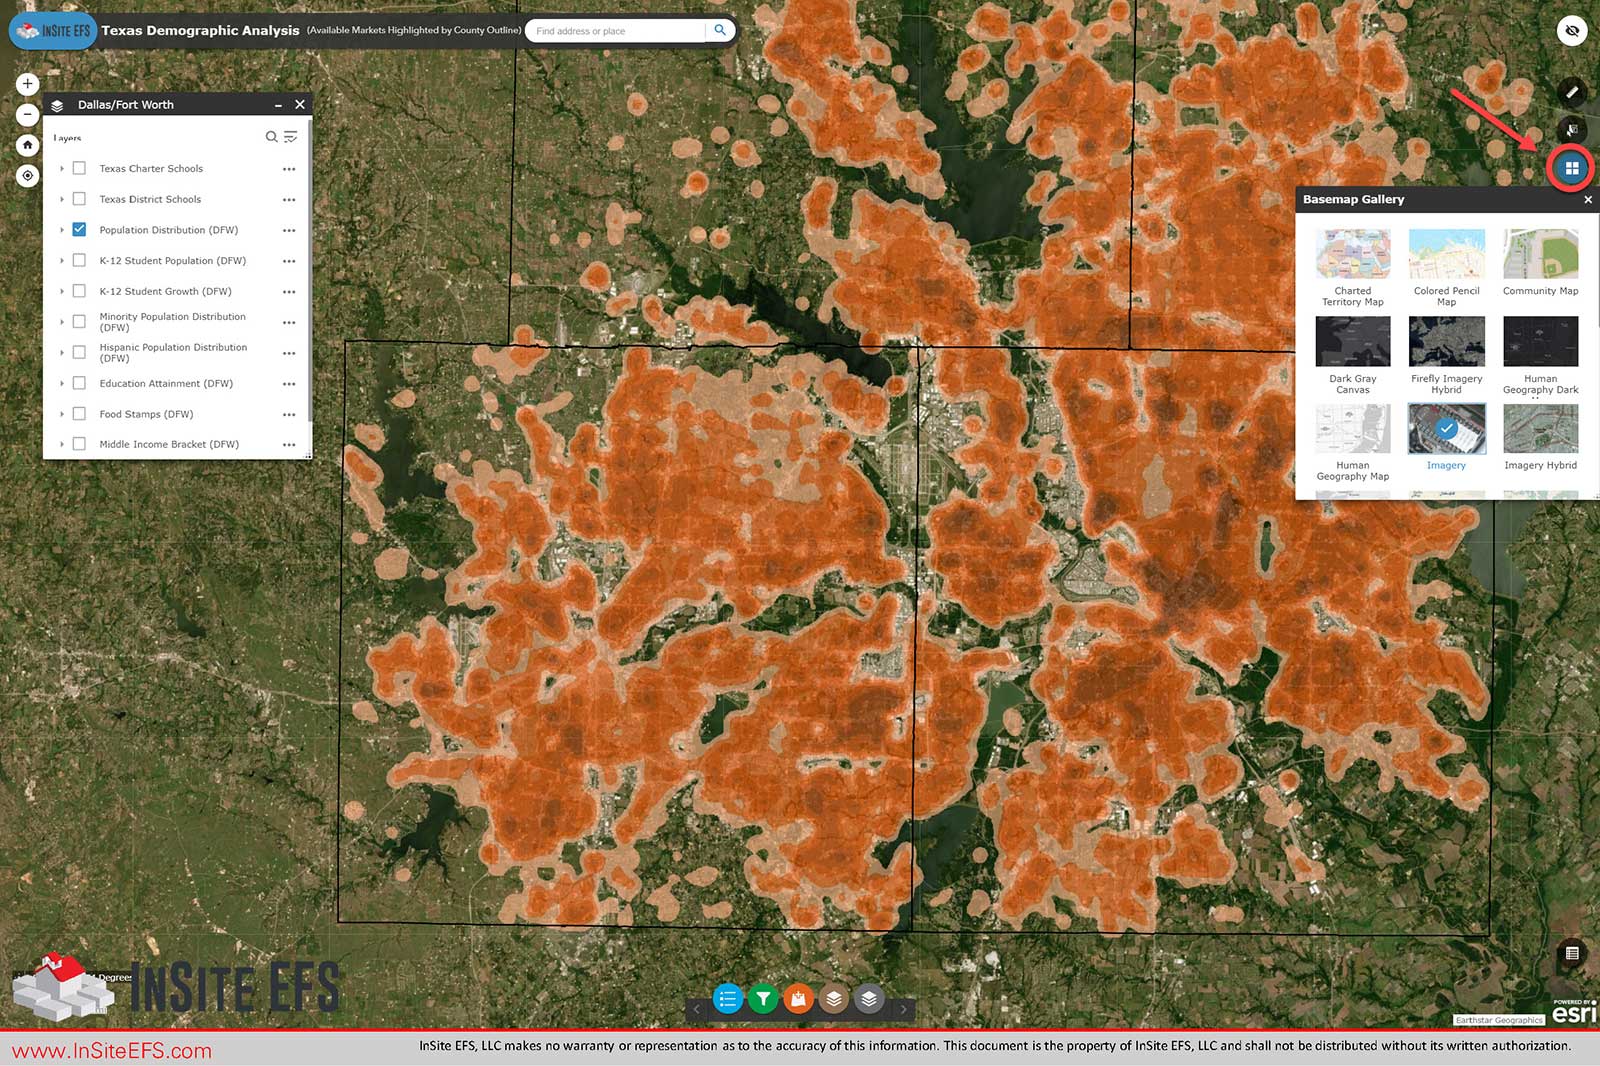
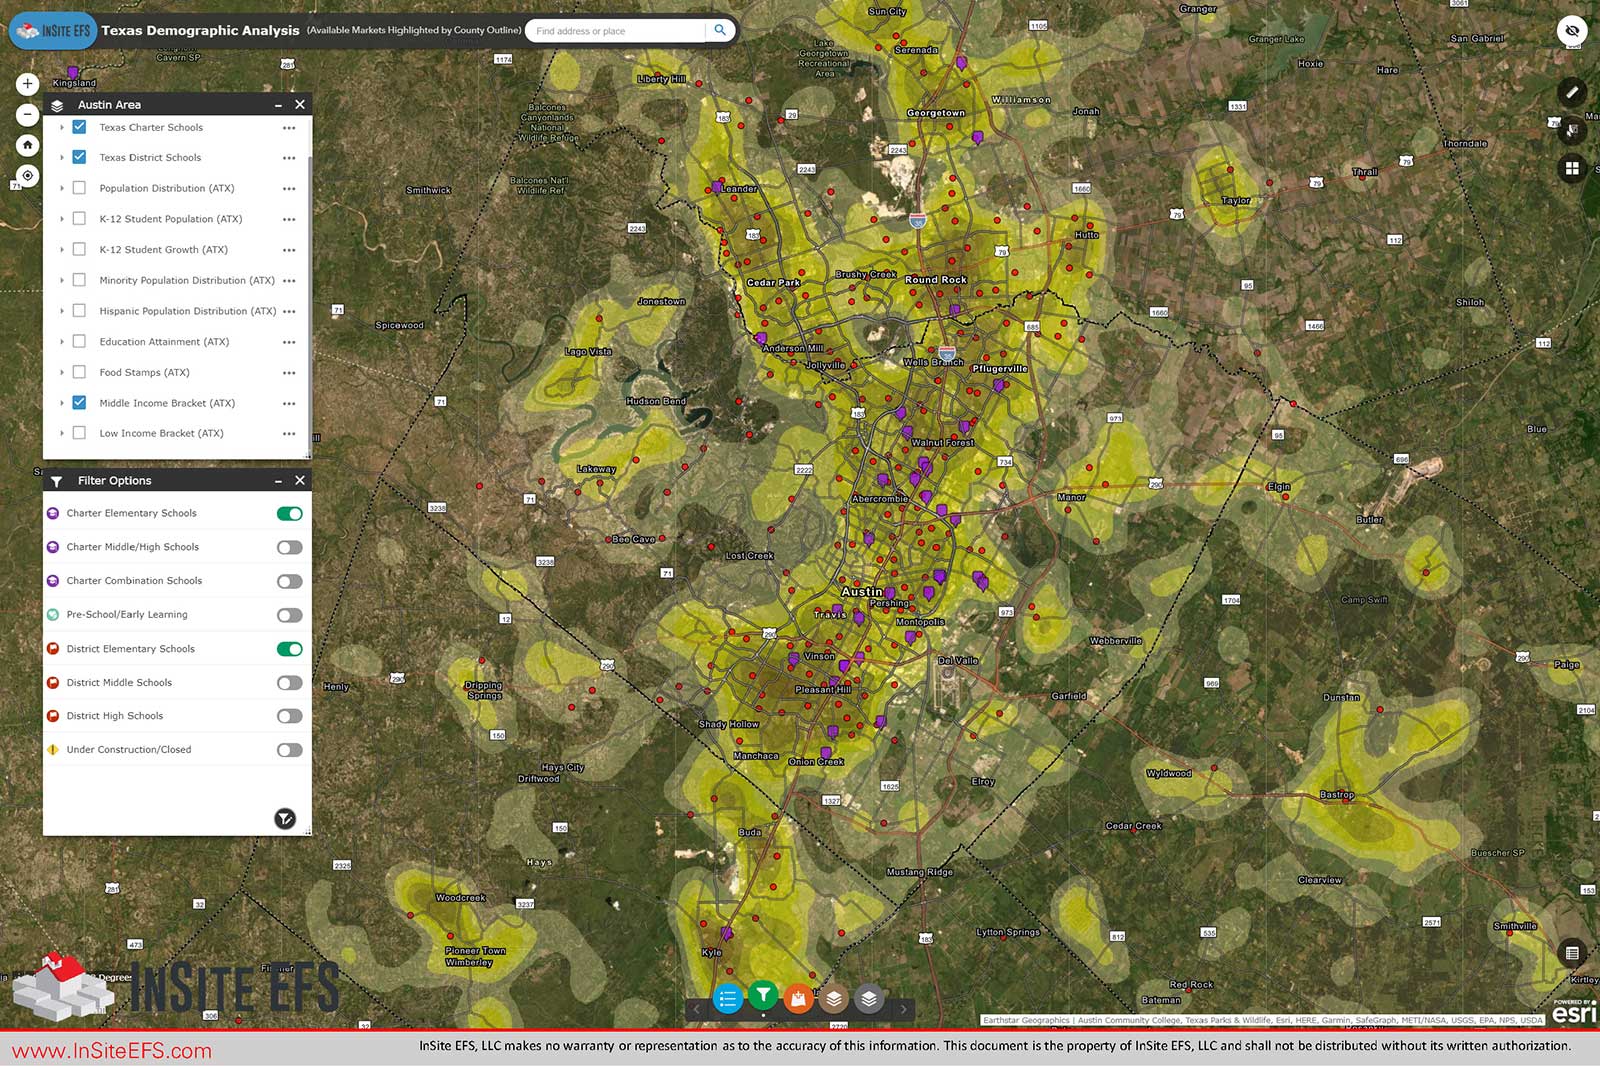
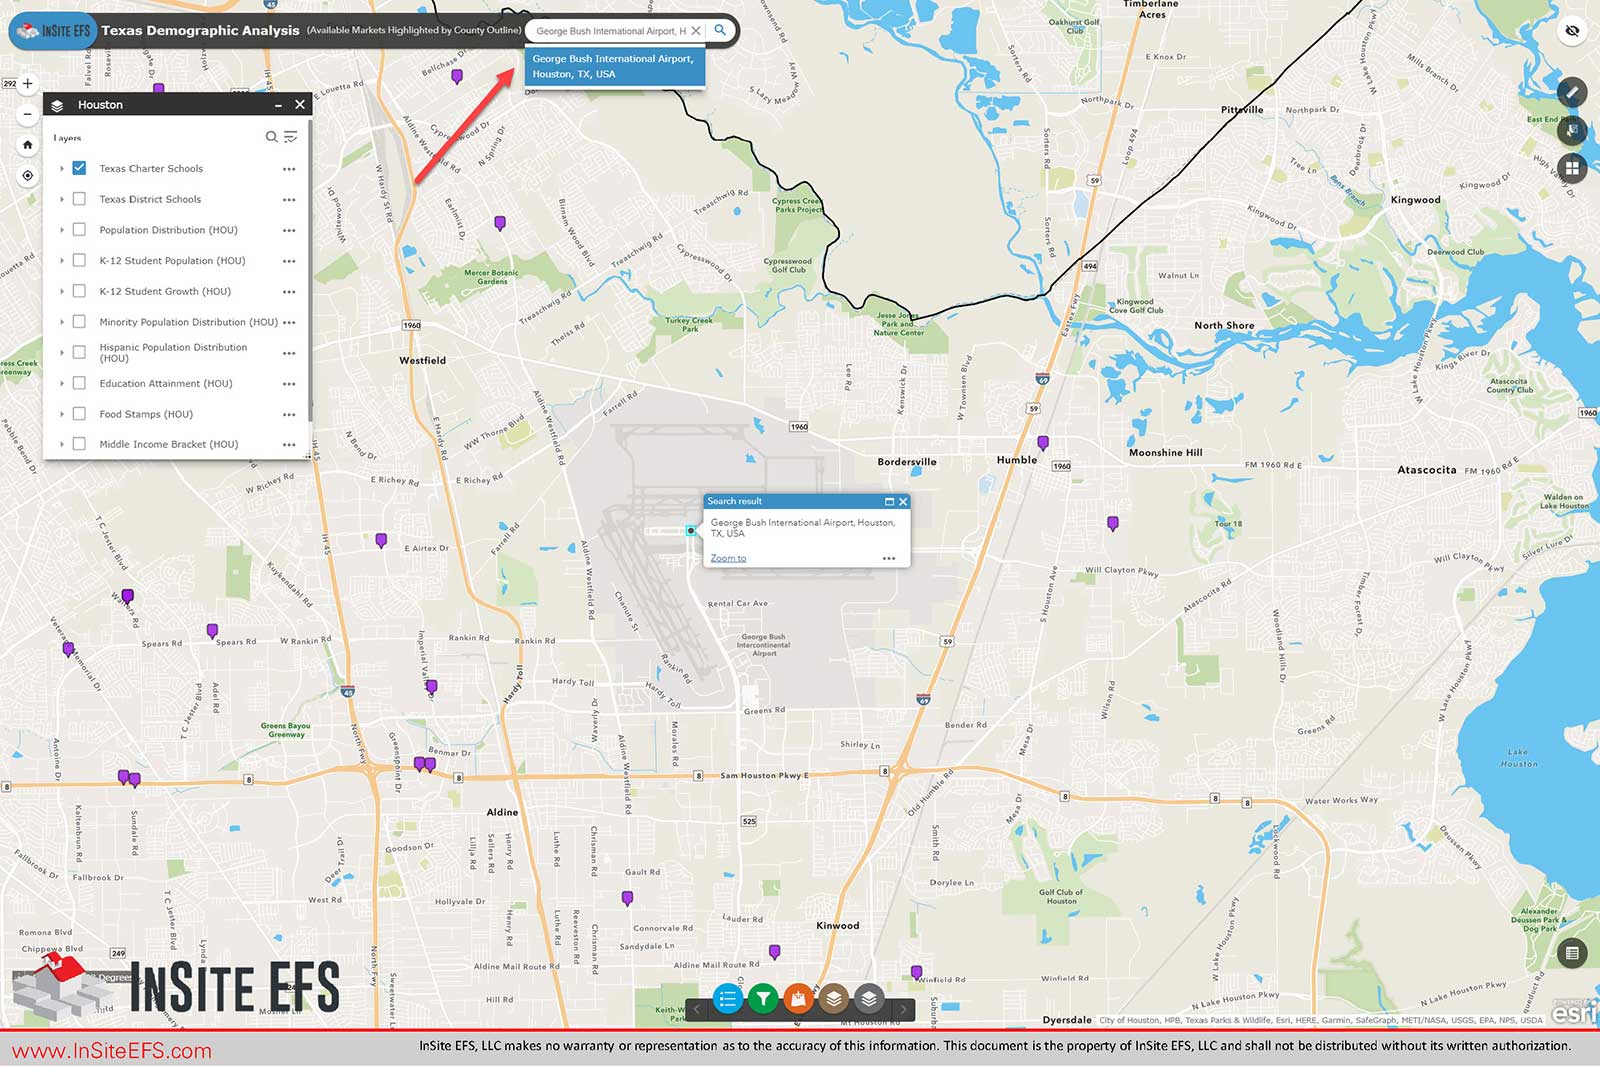
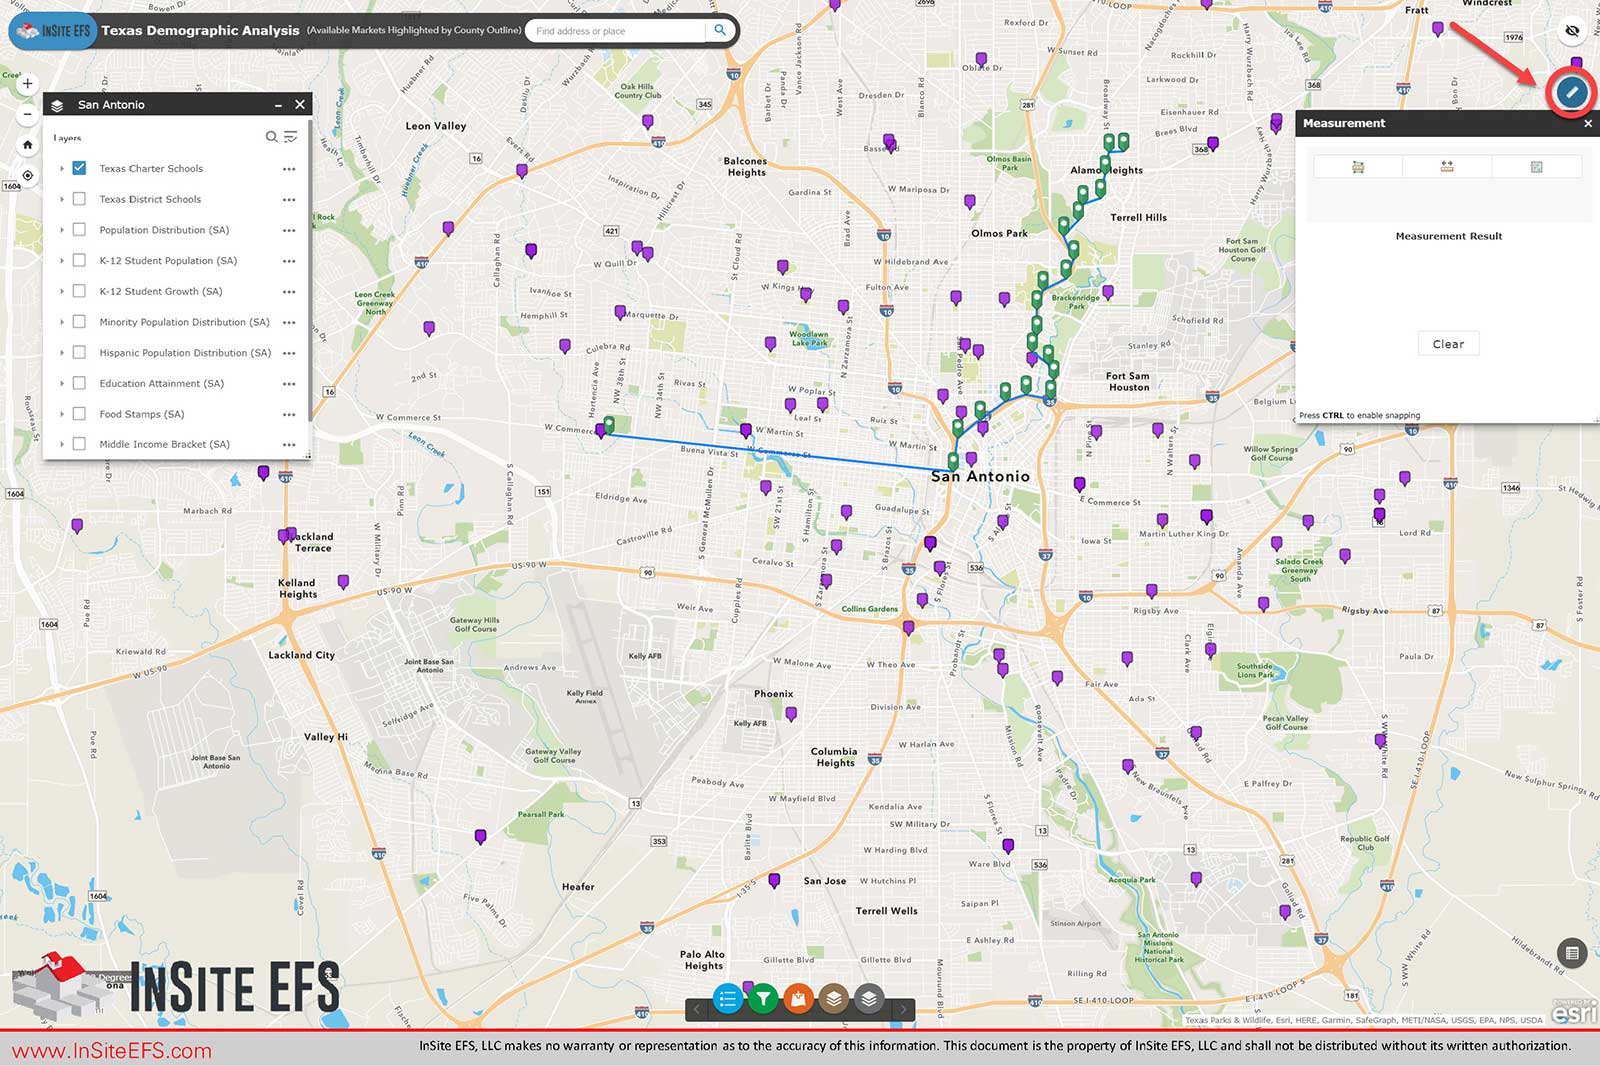
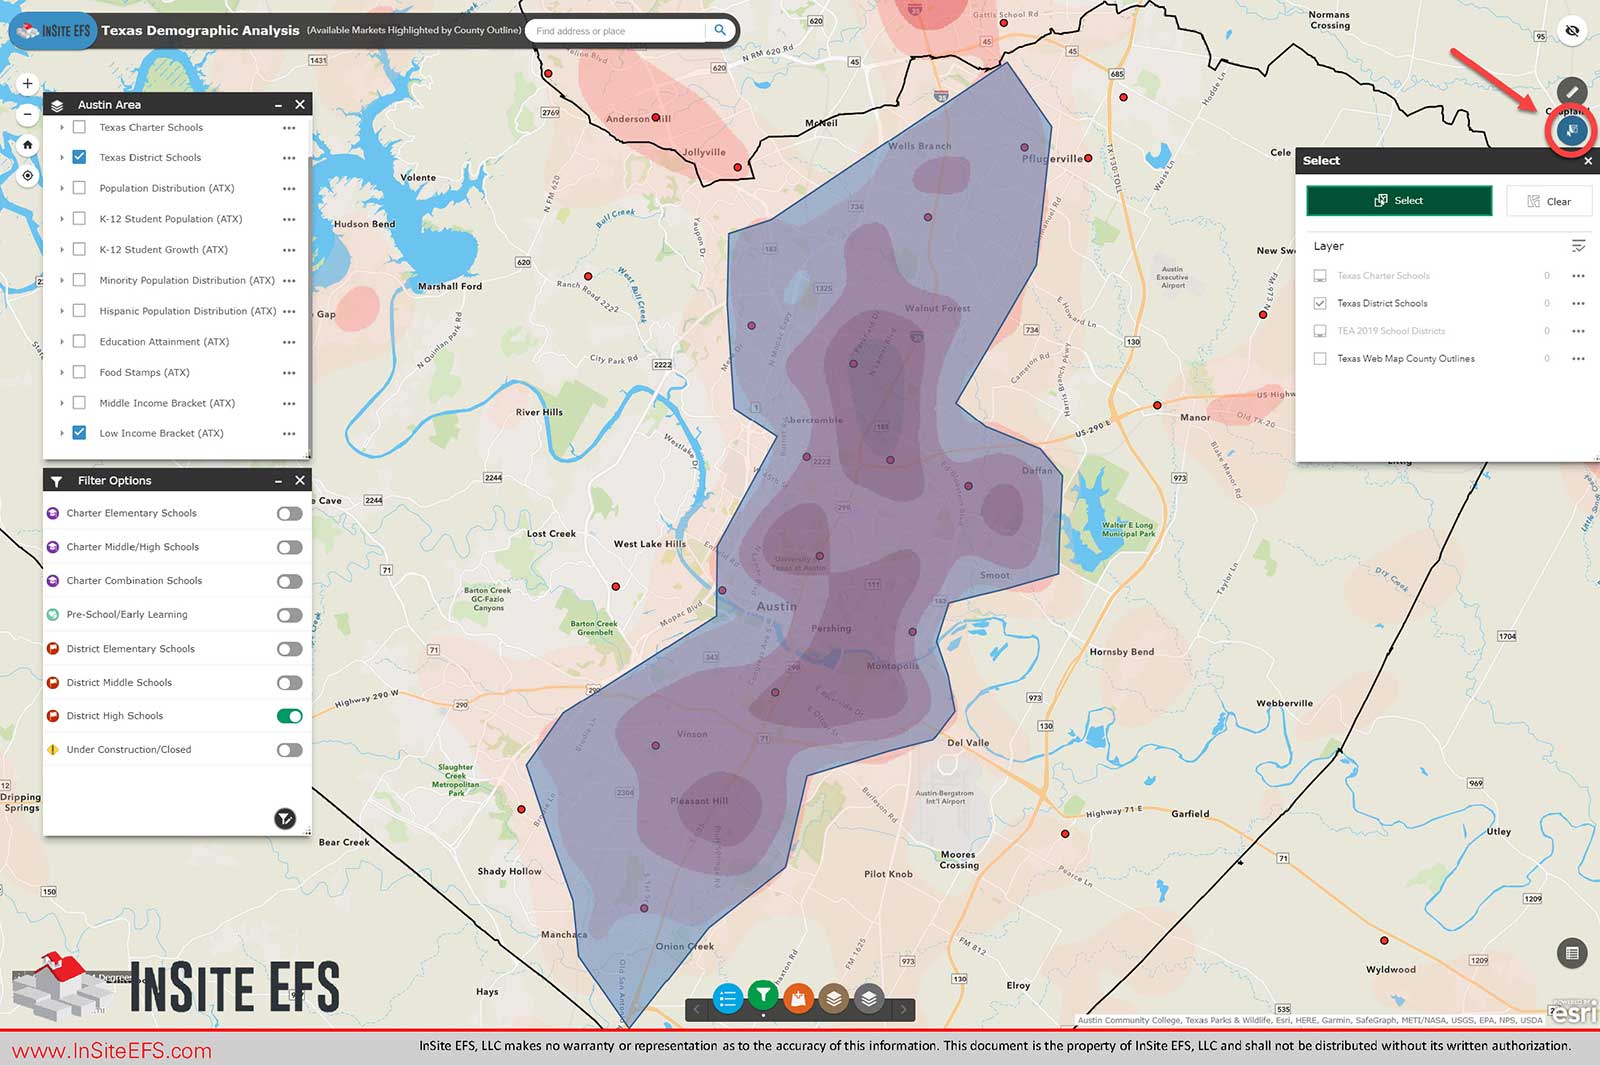
Overlay multiple Demographic Datasets in and around Texas Metro Areas to compare with District & Charter Schools, or a unique property address.
Already Purchased?
If you are returning customer, please log-in to view the webmap link on your accounts page.
Description
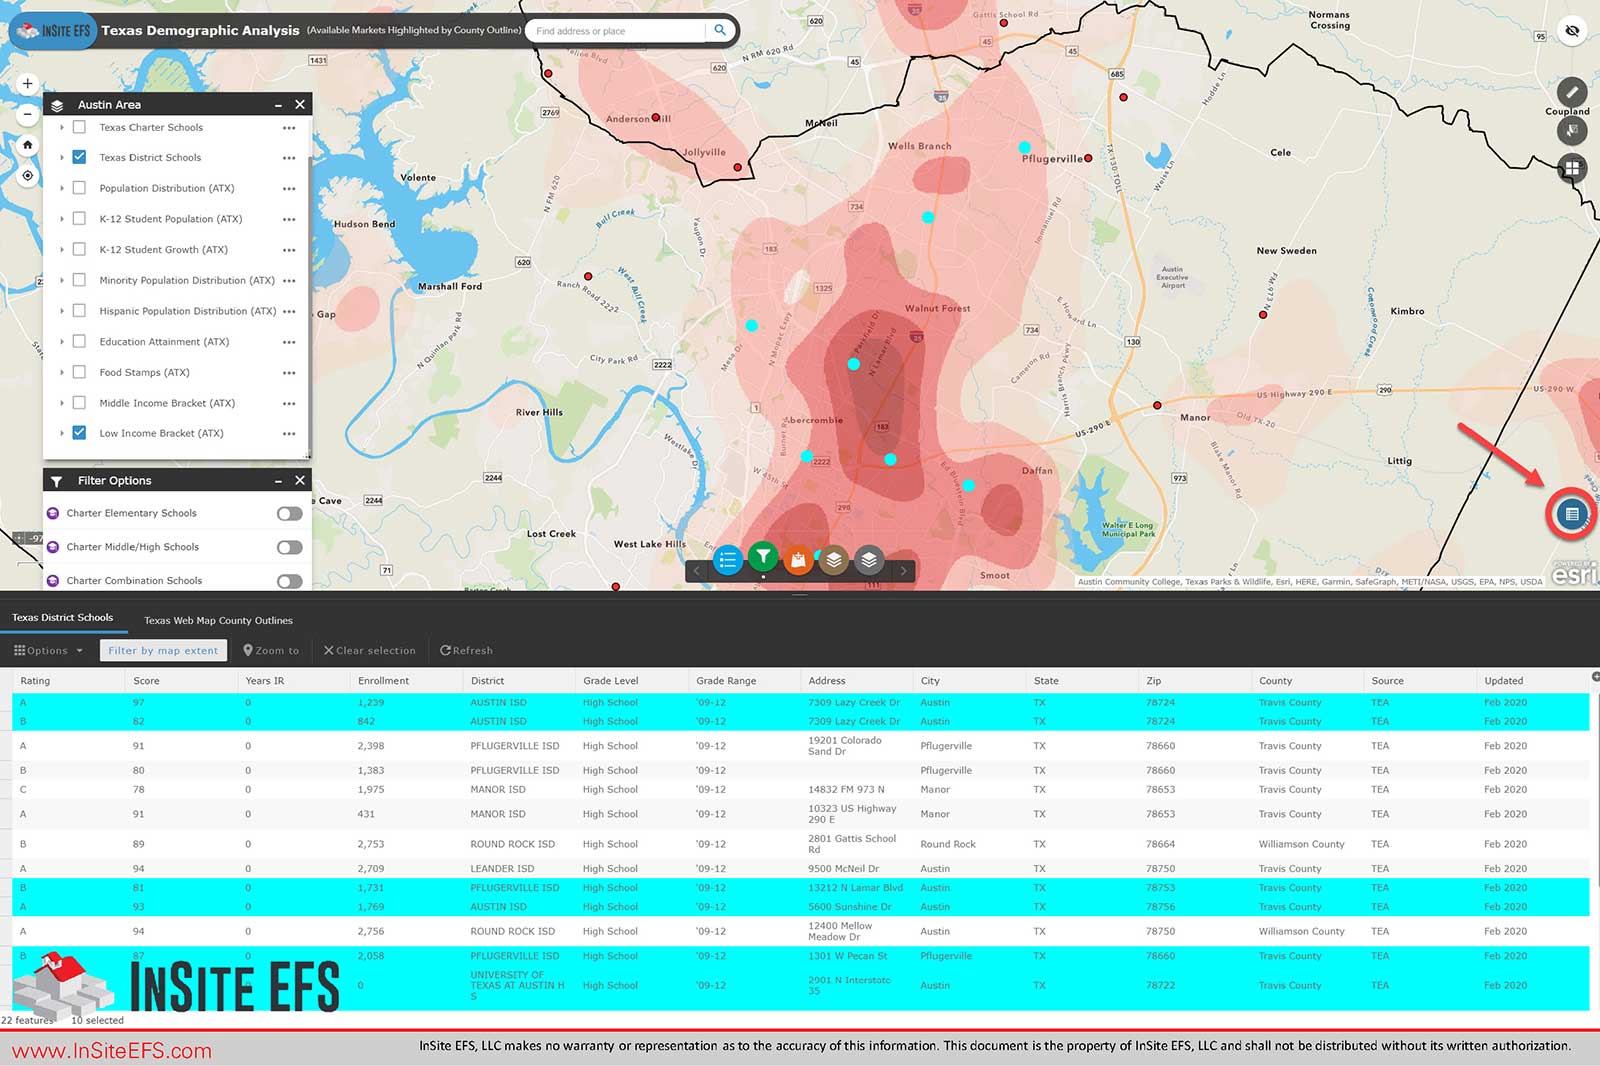
The Texas Demographics Analysis Map has 8 Demographic Variables mapped out in 5 Major Metro Areas. In addition to this, we’ve provided the ability to display all TEA Recognized District and Charter Schools (2019) with latest enrollment and ratings, along with TEA School Districts throughout the state of Texas.
Demographic variables include Total Population Distribution, K-12 Population Distributions, K-12 5-Year Growth, Minority and Hispanic Population Distribution, Education Attainment (Percent of Homes with a Bachelor’s Degree or Higher), Food Stamps (Percentage of Homes using Food Stamps), Low-Income Bracket (Annual HHI between $0-$50,000), and Middle-Income Bracket (Annual HHI between $50,000-$100,000). These variables can be toggled on/off in the following metro area’s and surrounding counties; Austin, Houston, San Antonio, Dallas, Fort Worth, Corpus, Christi, Midland, and Odessa.
Additional Information:
Please Reach out to our GIS Demographics Analyst if you have any additional questions about our web app or data.
Ryan Keller: ryan@insiteefs.com
Additional Information
| Subscription | Annual, Daily, Monthly |
|---|


